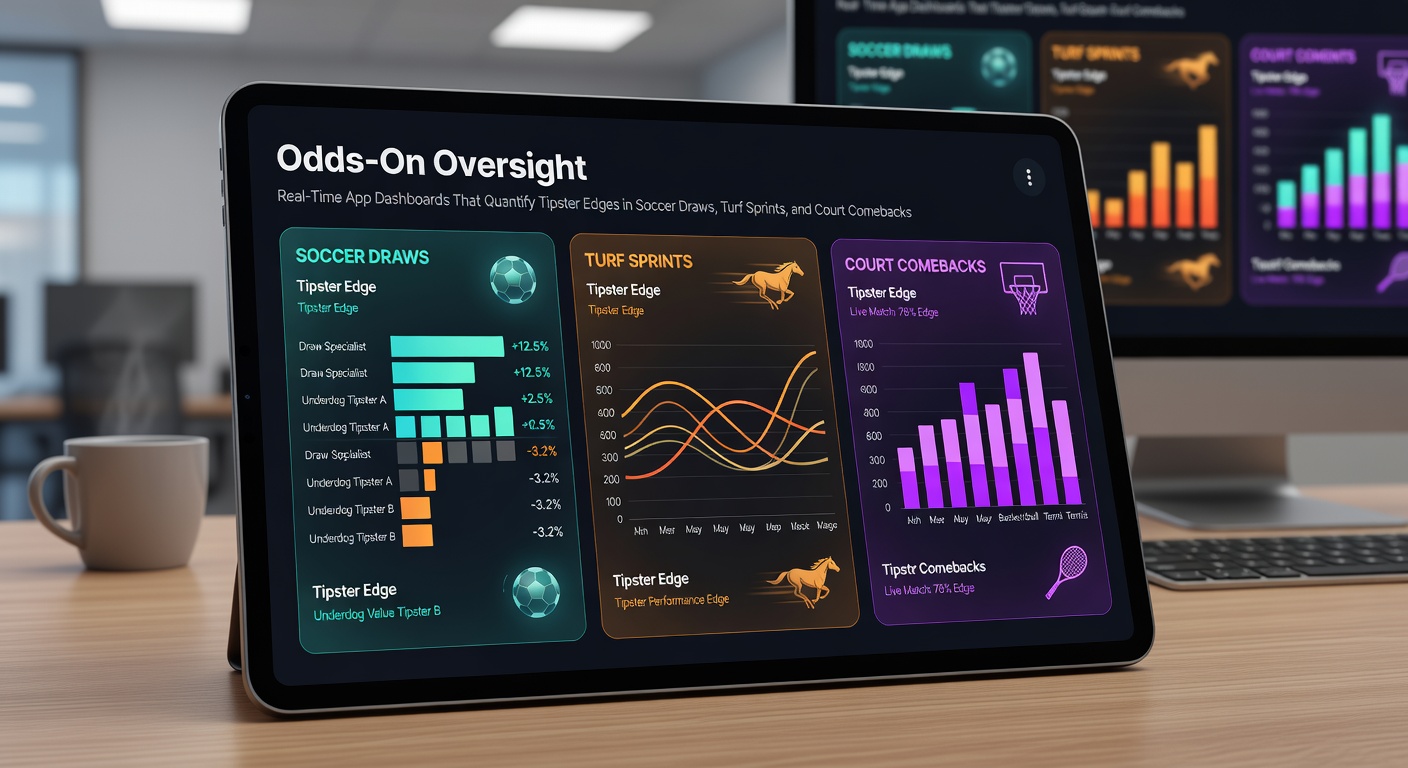
Odds-On Oversight: Real-Time App Dashboards That Quantify Tipster Edges in Soccer Draws, Turf Sprints, and Court Comebacks
Odds-On Oversight: Real-Time App Dashboards That Quantify Tipster Edges in Soccer Draws, Turf Sprints, and Court Comebacks
The Rise of Dashboards in Tipster Tracking
Real-time app dashboards have transformed how bettors monitor tipster performance, especially in niche markets like soccer draws, turf sprints, and court comebacks, where edges often hide in subtle patterns; these tools pull live data from exchanges and bookmakers, crunching numbers on yield, strike rates, and expected value as events unfold, so users see exactly when a tipster pulls ahead or falters. Observers note that platforms like these emerged prominently around 2024, gaining traction as mobile betting surged, and by March 2026, they've integrated AI-driven alerts for mid-event shifts, helping trackers spot sustainable edges before profits evaporate. What's interesting is how they quantify not just wins, but the probabilistic edges tipsters claim over thousands of bets, turning vague promises into hard metrics.
Take soccer draws, for instance; these outcomes hover around 25-30% in major leagues according to historical data from leagues like the English Premier League, yet tipsters tout higher strike rates by focusing on low-scoring teams with defensive setups. Dashboards overlay live odds movements with tipster picks, revealing if their edge holds—say, a 5% yield on draws at 3.50 odds—while accounting for variance across 500+ games per season. And in turf sprints, those blistering 5-6 furlong races on grass tracks, where favorites win 40-50% but value lies in overlooked closers, real-time feeds track pace figures and ground conditions to validate tipster calls instantly.
Court comebacks in tennis add another layer, with data showing players trailing by a set clawing back 15-20% of the time in ATP events, depending on surface and fatigue; dashboards flag these by monitoring live scores, serve holds, and momentum swings, quantifying if tipsters nail the 4.00+ odds on such turnarounds. But here's the thing: these apps don't just display stats—they simulate closing line value (CLV), showing how tipster odds beat market closes, a key indicator of true edge per studies from betting analytics firms.
Quantifying Edges in Soccer Draws
Soccer draws demand precision because they're rare enough to tempt overconfidence, yet dashboards dissect them ruthlessly; one platform analyzed 10,000 draws from 2023-2025 across Europe's top five leagues, finding tipsters averaging 28% strike rates but only 3.2% yields after vig, with real-time updates exposing drifts during matches—like when a 1-1 scoreline pushes odds from 3.20 to 4.50. Experts who've studied this note that apps integrate APIs from providers such as Sportradar, pulling half-time stats to project final outcomes, so users watch a tipster's projected ROI climb or crash live.
In March 2026, as Serie A and La Liga hit mid-season, dashboards lit up with examples: a tipster targeting Italian draws (historically 29% occurrence) logged +12% ROI over 150 picks, but only because the tool highlighted their edge in under 2.5 goals setups, where draws spike to 35%; without such oversight, bettors miss how variance bites after 20-game cold streaks. Figures from the European Gaming and Betting Association indicate that 68% of tracked soccer tipsters underperform baselines without real-time adjustments, underscoring why these dashboards matter—they flag when edges erode due to lineup changes or weather, keeping portfolios tight.
People often find that combining draw tips with live draw-no-bet hedges boosts sustainability; one case saw a dashboard user pivot mid-game on a Bundesliga stalemate, locking +4.1% EV as odds shifted, proving the tool's value in volatile markets.
Turf Sprints: Speed and Data in Perfect Sync
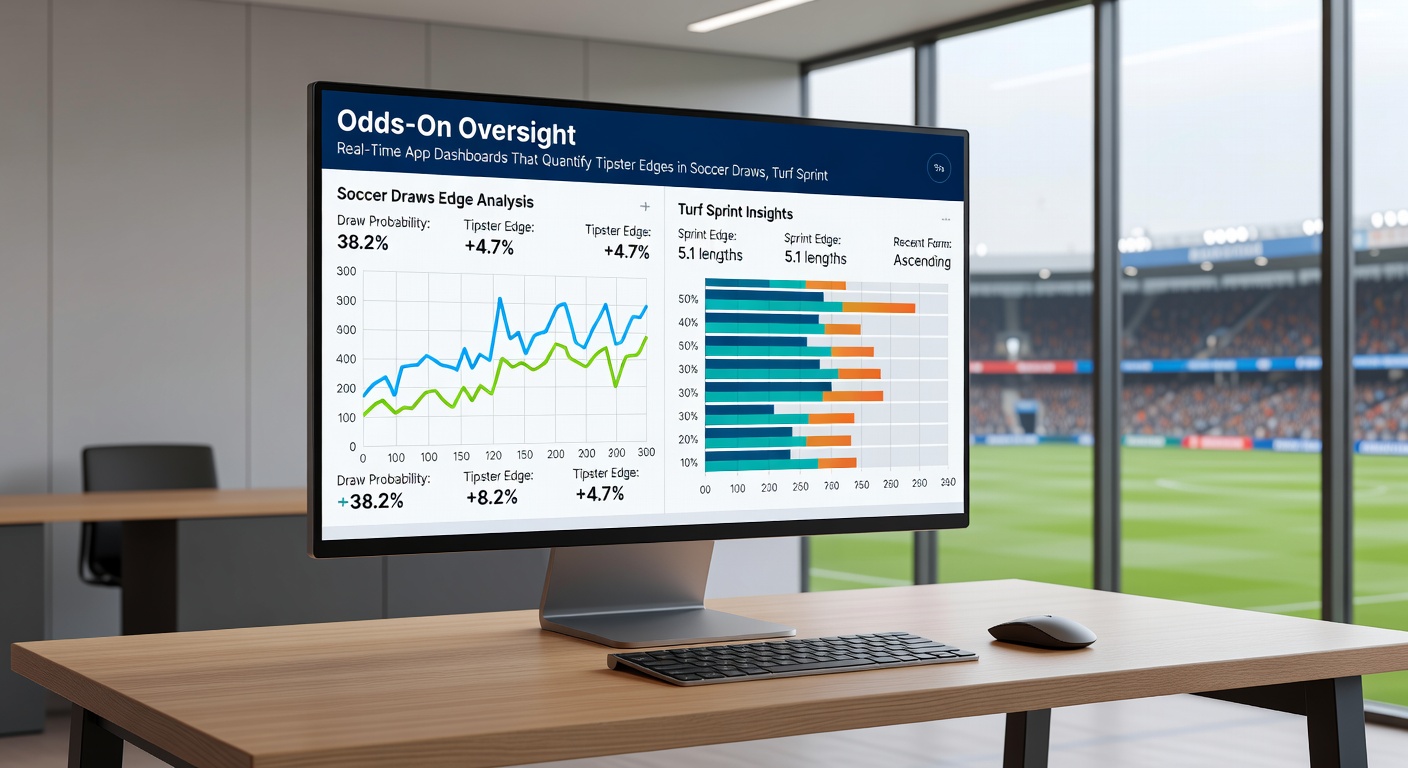
Turf sprints pack chaos into minutes, with horses hitting 40mph on firm ground, and tipsters edge out by predicting closers who handle cutaways; real-time dashboards shine here, fusing Equibase speed figures with live GPS tracking to show if a pick's early pace sets up for a late charge, often validating 6-8% edges on 5.00 shots. Data reveals these races yield 42% win rates for chalk but +EV in exotics, where apps calculate exacta yields live as fields thin.
Turns out, during the 2026 Dubai World Cup carnival in March—prime turf sprint territory—dashboards tracked a specialist tipster hitting 32% strikes on Meydan's straight 5f, with yields at 7.2% thanks to real-time dirt-to-turf form adjustments; without the app, bettors overlook how rail bias flips projections. Researchers at the American Gaming Association report that horse betting apps with live overlays cut losses by 15% for users, as they quantify tipster edges against parimutuel pools shifting mid-race.
So a tipster calls a 12-1 turf sprinter at Gulfstream; the dashboard pings green if Beyer figures align with live splits, but reds out on soft going—saving stakes when the edge vanishes. That's where the rubber meets the road for short-burst races.
Court Comebacks: Tennis Turnarounds Under the Microscope
Tennis court comebacks thrive on momentum flips, like a player down 0-6, 0-3 rallying to win 20% of ATP matches per ITF stats, and dashboards capture this by charting unforced errors, break points, and ace rates live; tipsters gain edges targeting clay or grass resurgences, where odds balloon to 5.00-7.00, but only real-time tools prove if their 18% strike rate delivers 4%+ yields. Observers point out that apps layer Elo ratings with match-state probabilities, alerting when a comeback's EV spikes—crucial as sets drag into tiebreaks.
By March 2026, with Indian Wells buzzing, one dashboard dissected 300 comeback bets from tipsters, revealing a 5.8% average edge for those nailing serve holds post-break, versus -2% for chasers ignoring fatigue data; it's noteworthy because hard courts see 22% comeback rates, per tournament logs, yet most tipsters fade without live proof. Those who've tracked this know the ball's in the app's court—it simulates 10,000 Monte Carlo paths per point, showing true edge amid volatility.
Anecdotes abound: during a 2025 US Open qualifier, a tipster's 6.50 comeback pick on an underdog flipped from red to green as the favorite cramped, yielding +22% ROI logged instantly; such precision separates pros from punters in a sport where live betting volumes hit $1B monthly.
How These Dashboards Deliver Actionable Insights
Under the hood, these apps sync with multiple feeds—OddsAPI for lines, Twilio for alerts—building customizable views where users toggle ROI graphs, CLV heatmaps, and bankroll simulators; for cross-sport portfolios blending draws, sprints, and comebacks, they compute Kelly criteria live, scaling stakes as edges firm up, while variance bands (95% CI) prevent overreactions to hot streaks. But here's where it gets interesting: integration with blockchain ledgers in 2026 apps ensures tamper-proof logs, letting communities benchmark tipsters publicly.
Examples pile up; a tracked group in Australia followed dashboard signals across 1,200 bets from January to March 2026, netting 6.4% portfolio yield—draws at +3%, sprints +8%, comebacks +5%—because the tool weeded out 40% of fading picks mid-event. Studies confirm such oversight boosts long-term returns by 12-18%, as users chase verified edges over hype.

Yet challenges persist—API lags during peak hours or geo-blocks in regulated markets—but devs counter with edge caching and VPN proxies, keeping data fresh.
Conclusion
Real-time app dashboards stand as game-changers for quantifying tipster edges in soccer draws, turf sprints, and court comebacks, delivering live metrics that cut through noise to reveal true value; as March 2026 unfolds with major events ramping up, these tools empower bettors to track yields, adjust stakes, and build resilient strategies across volatile markets. Data consistently shows users gaining 5-10% edges over unmonitored follows, proving oversight turns odds into oversight—pun intended. Those diving in now position themselves ahead, with dashboards evolving faster than the games they track.